Pulse counter
To simplify the reading and evaluation of my electricity meter, I have built a reading head using an ESP32 board and a TRCT5000 infrared sensor. Unfortunately, I still have an old, so-called “Ferraries electricity meter”. But this one has a turntable with a red mark. This makes X revolutions per kWh, in my case 75. By the duration of a revolution the momentary consumption can be calculated then.
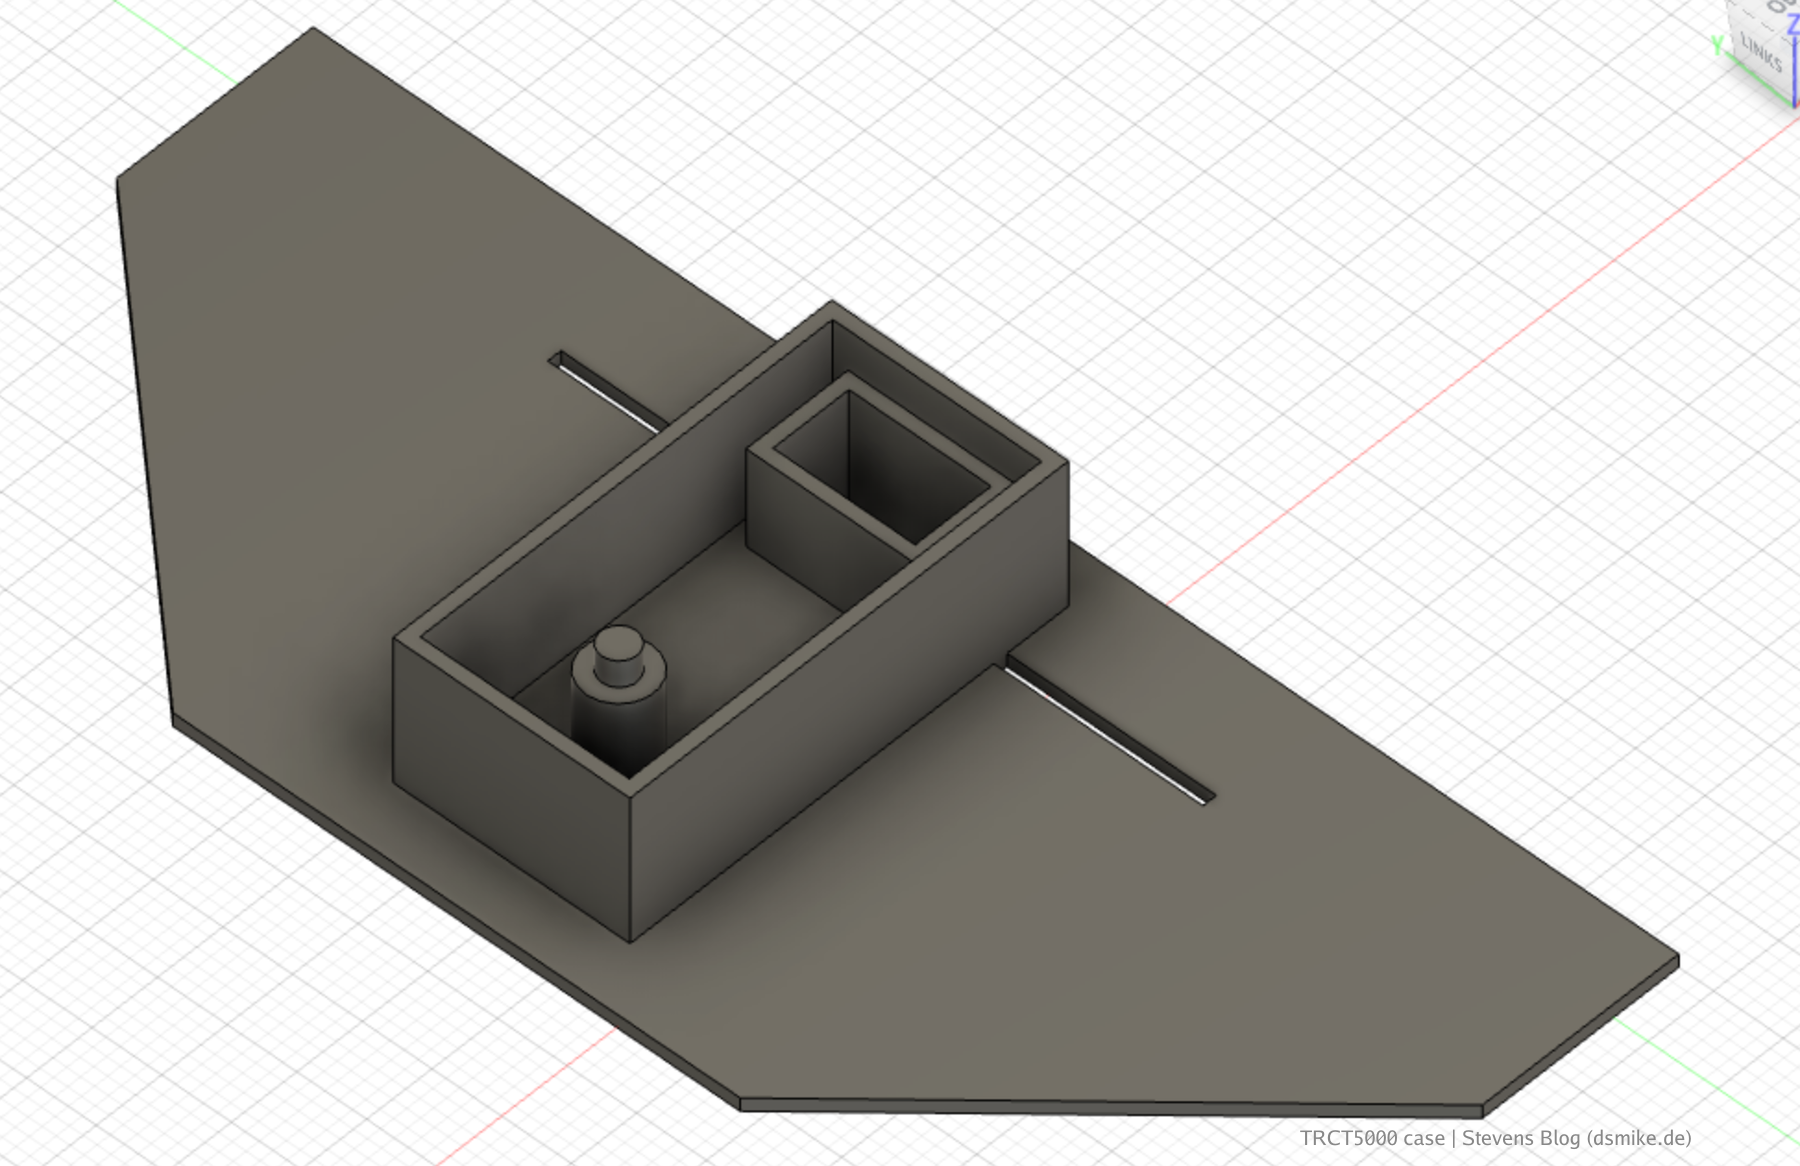
For the sensor, I then 3D printed a housing to mount it on the meter and align it. To fix the sensor, I used adhesive tape, which is normally used to mask walls when painting, in order to get sharp edges. This tape can be removed easily and still sticks sufficiently. I designed the case in Autodesk Fusion 360.

The TRCT5000 I use has a potentiometer with which the sensitivity of the digital output can be adjusted. So theoretically the sensor can be adjusted to be on at the red mark and off otherwise. This was also my first attempt. Unfortunately, the correct setting was felt to be within a 0.1° turn. Somehow I did manage to adjust it reasonably and ran it for a while. It worked a bit too, but not satisfactorily. One problem was that the signal still jumped back and forth a lot during the transition. This could still be handled with a digital debouncing. Another problem was that after a while no more turns were recognized. I don’t know exactly why, maybe it was different lighting conditions or the housing slipped a millimeter? But for me it was clear, I need another solution.
For the next attempt I used the analog output of the TRCT5000, which fortunately my board has. Here I first measured with the oscilloscope. The difference between red and not red was, if I remember right, 15 mV. If you set the ESP32 to the gain ADC_ATTEN_DB_0 and use 12 bit resolution, it offers an accuracy of about 0.2mV, which should be sufficient.
So I hooked up the TRCT5000 to an analog input from the ESP32 and started writing firmware for it. First the thresholds were hard programmed in, which worked quite well. For this I used two limits. One which must be exceeded for red, another which must be fallen below for not red. Also here I had at the beginning still now and then wrong impulses.
To improve the signal, I smoothed the raw data. For this I used a moving average with a window of 10 samples. I do the sampling with a timer interrupt of one millisecond. Additionally I built in an automatic calibration, which at the beginning just creates a table, which value was read how often. From the table it then tries to find two hills, with a valley in between, to set the limits.
The result was then tested over two weeks by reading the meter manually and comparing the difference with my solution. The difference was 0.1 kWh, but that could also be from the reading. I am satisfied with the result.
The ESP32 currently sends the absolute values in kWh and the current consumption in watts to my Raspberry where they are stored in an InfluxDB. Additionally I store the individual pulses, this helped to identify super wrong values at the beginning.
For evaluation I use a dashboard in Grafana, in which I can see the power consumption over time.

Here how the single pulses look like:

Translated with www.DeepL.com/Translator (free version)